Introducing advanced charts

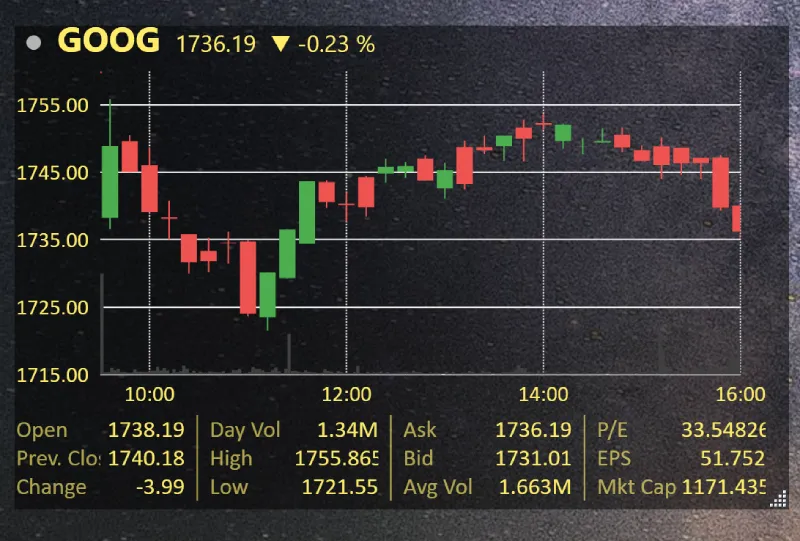
We are happy to announce that we are introducing OHLC and Candle charts in this update.
The illustration shows a candlestick chart. OHLC is also available. It is still a work in progress, so we would be happy to hear your sugguestions!
- Next: Windows 11 is here!
- Previous: Feature sneak peek!